
In this post, I want to zoom in on CloudWatch Metric Filters. I’ve been a loyal CloudWatch user for years but only recently, I stumbled upon the “hidden” CloudWatch Metric Filter Debugger. You can imagine the surprise on my face. This filter debugger is a great tool to help you write and test metric filter Patterns.
If you’re not familiar with CloudWatch Metric Filters:
Metric filters define the terms and patterns to look for in log data as it is sent to CloudWatch Logs. CloudWatch Logs uses these metric filters to turn log data into numerical CloudWatch metrics that you can graph or set an alarm on.
With a proper Metric Filter and alarm in place, you get notified whenever a particular message is logged to CloudWatch. The hardest part of the setup is writing the filter pattern itself. A correct pattern will capture the things of interest and ignore everything else (avoiding false positives).
The Metric Filter Syntax is easy and concise, but it can be challenging to get a perfect filter pattern.
Here’s a filter pattern example:
  CloudInitLogGroupFilter:
    Type: AWS::Logs::MetricFilter
    Properties:
      FilterPattern: "[(w1=\"*ERROR*\" || w1=\"*Error*\" || w1=\"*error*\")]"
      LogGroupName: !Ref CloudInitLogGroup
      MetricTransformations:
        - MetricValue: "1"
          DefaultValue: 0
          MetricNamespace: SomeNamespace
          MetricName: !Sub cloud-init-${EnvironmentName}-errors
Often you’ll start writing match criteria only and extend these later with additional exceptions once you run into false positives.
An extended filter ignoring noise:
  HttpdErrorsLogGroupFilter:
    Type: AWS::Logs::MetricFilter
    Properties:
      FilterPattern: "[(w1=\"*ERROR*\" || w1=\"*Error*\" || w1=\"*error*\") && w1!=\"*IO ERROR*\" && w1!=\"*tlsmc_cert_create_hash_symlink*\"]"
      LogGroupName: !Ref HttpdErrorsLogGroup
      MetricTransformations:
        - MetricValue: "1"
          DefaultValue: 0
          MetricNamespace: SomeNamespace
          MetricName: !Sub httpd-errors-${EnvironmentName}-errors
Now, the eye-opener: apparently, it’s possible to debug your Metric Filters in the AWS Web Console 💎.
The CloudWatch Metric Filter Debugger
To find the Metric Filter Debugger, go to the detail page of a Log Group that contains a Metrics Filter, then click the “Metrics” tab followed by the Metric filter name link.
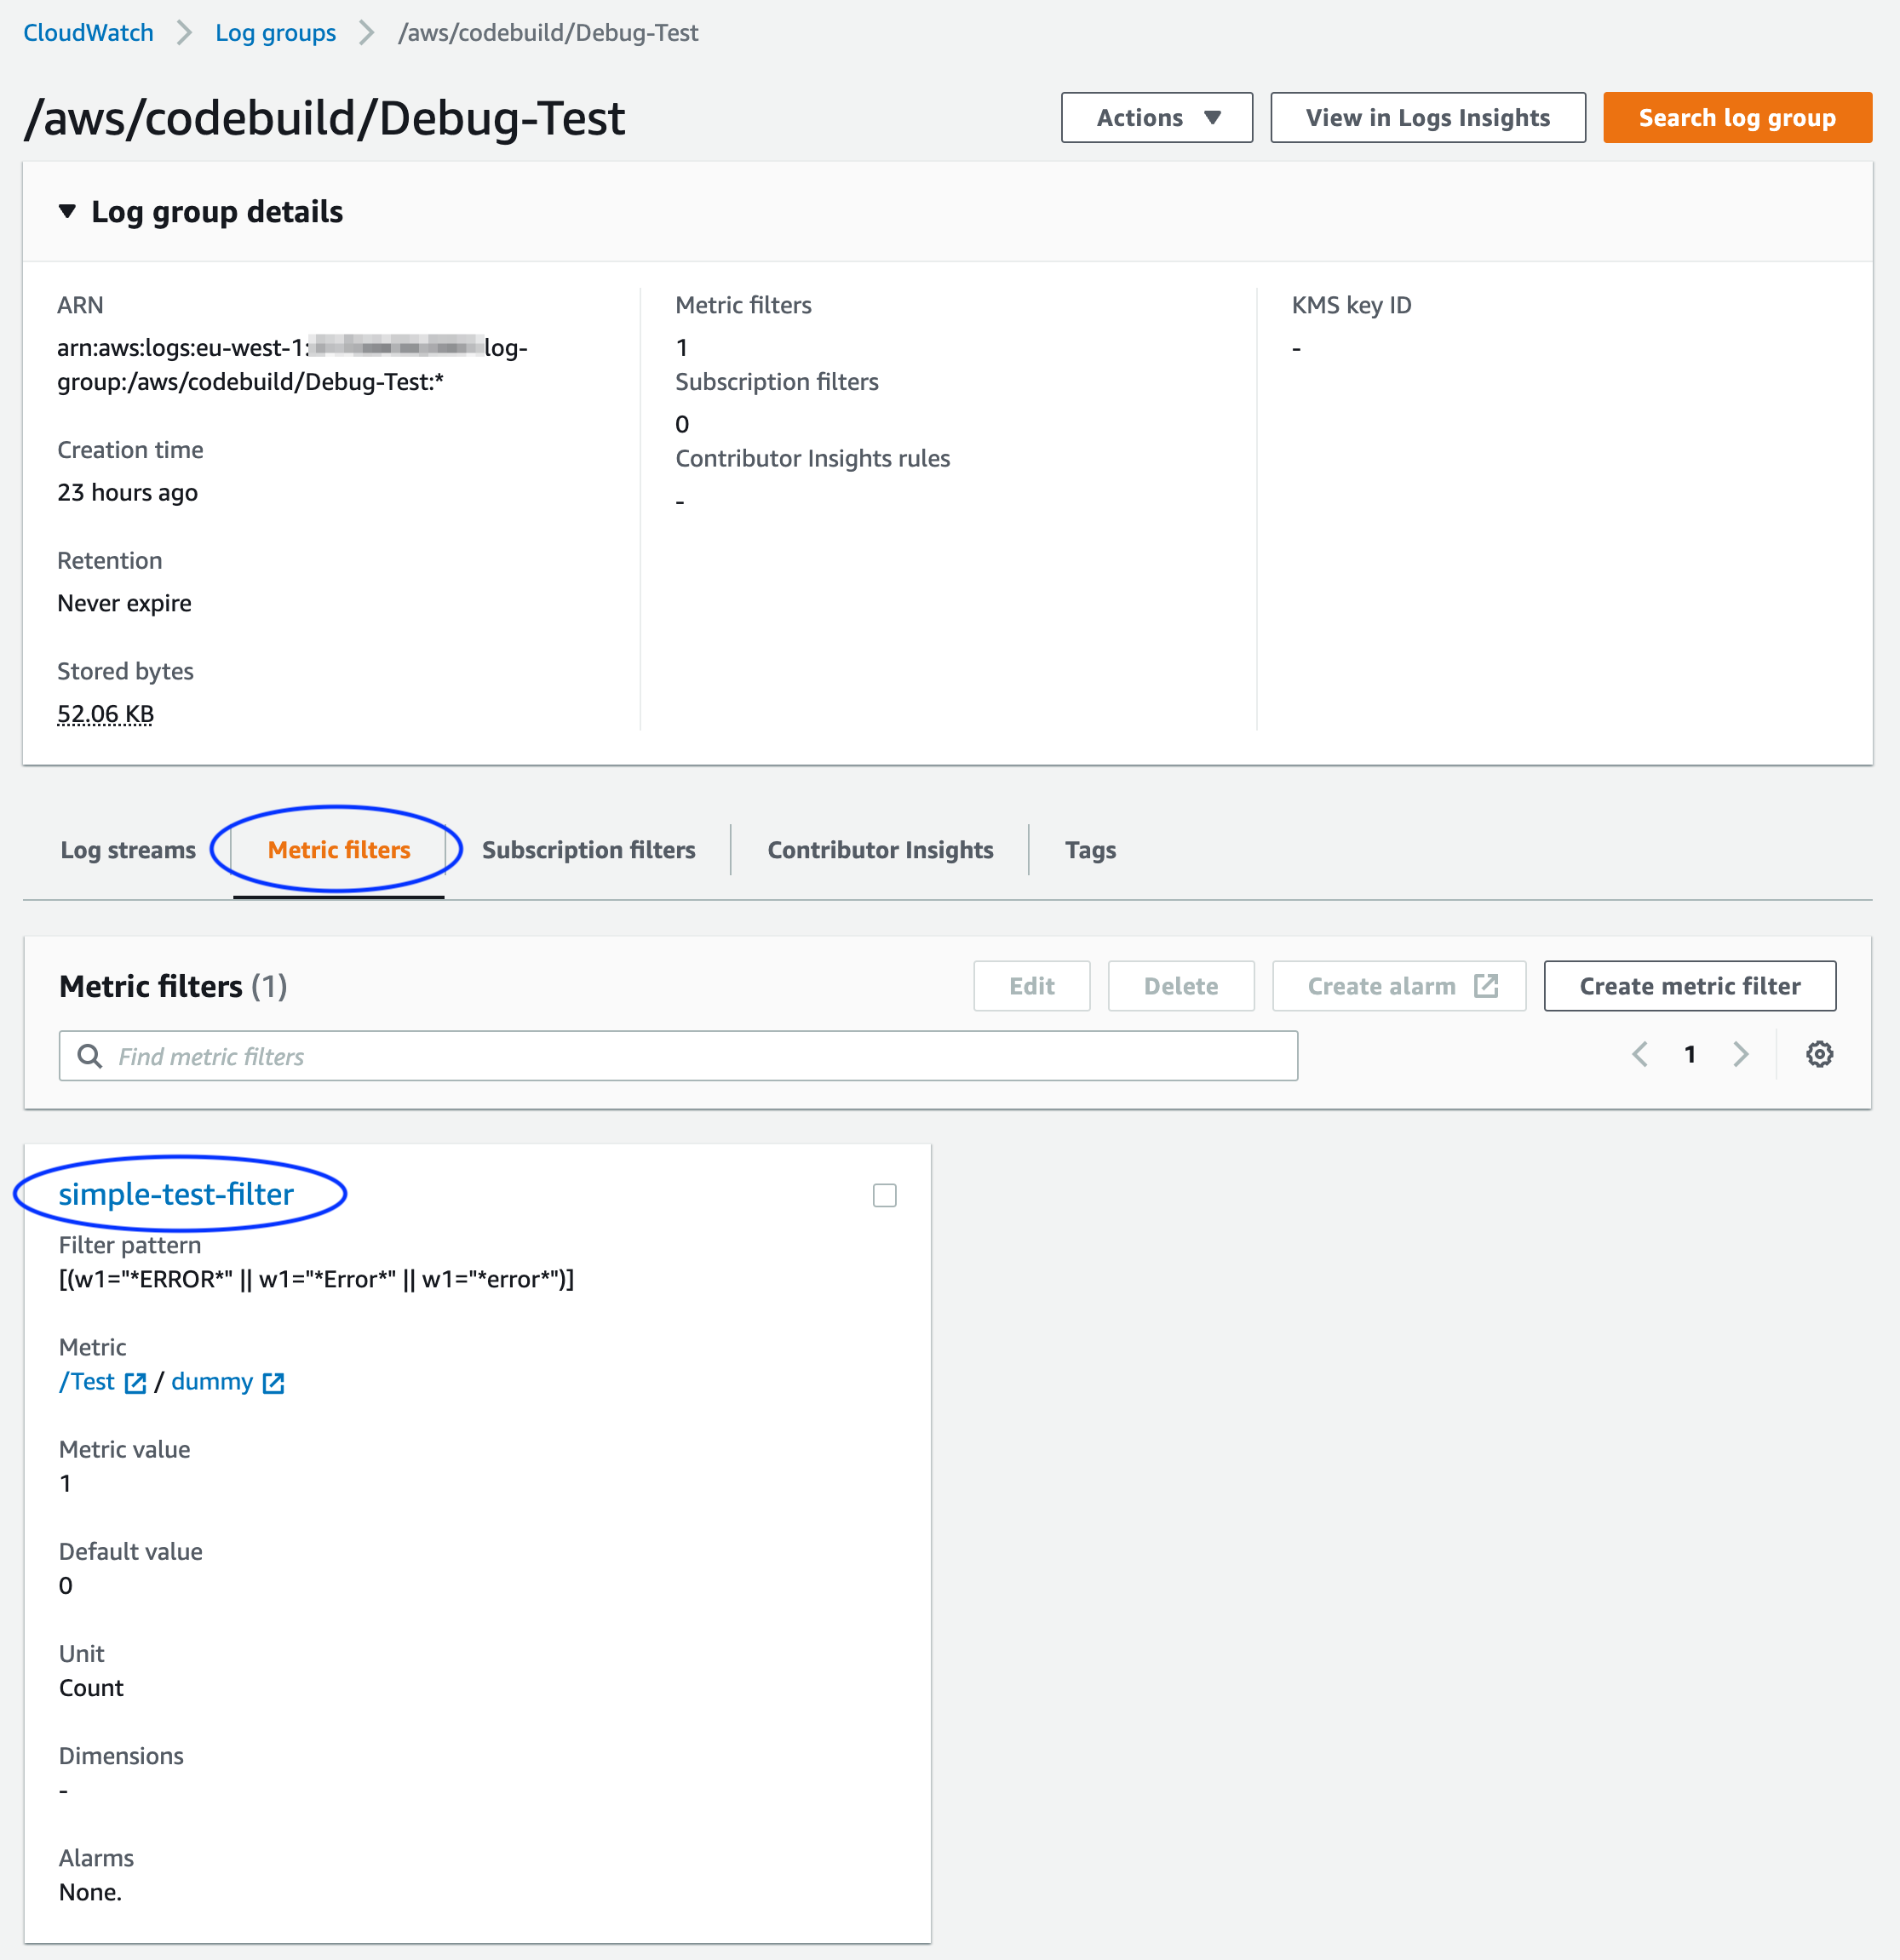
Ta-da, there’s the debugger:
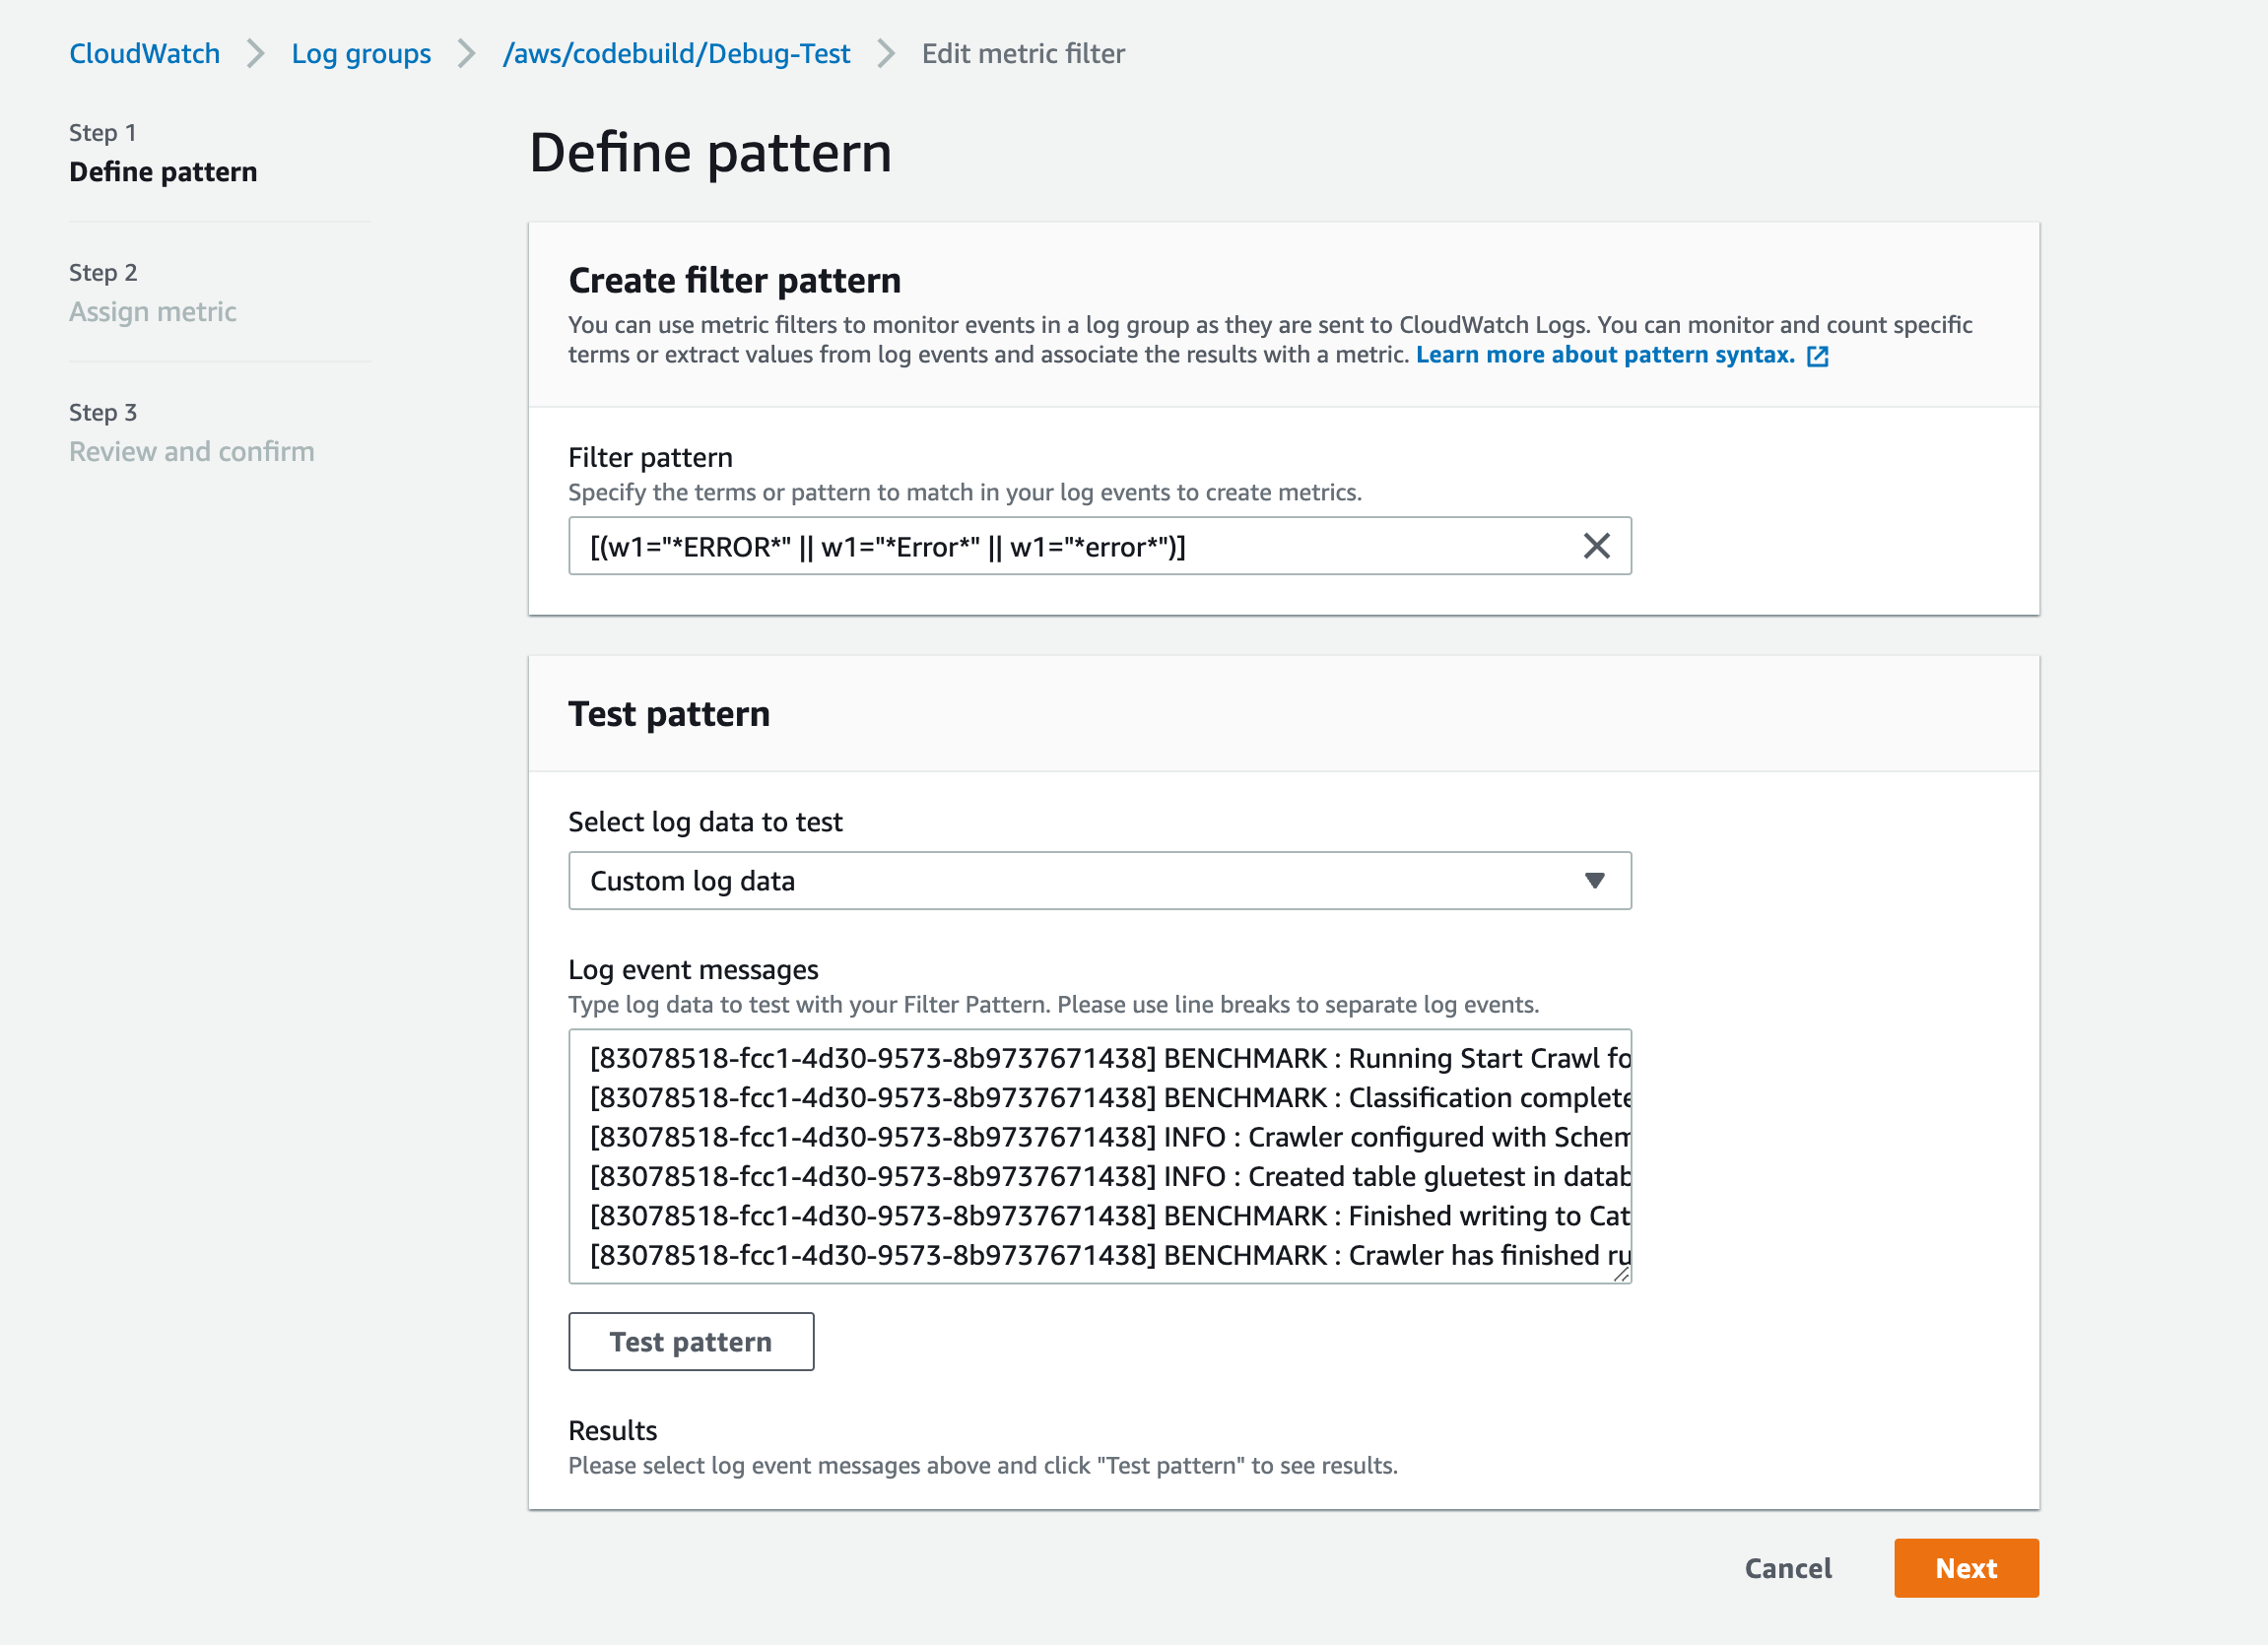
Needless to say that it’s a lot easier to test your Metrics Filter using this debugger. It saved me at least a few trial-and-error deployment cycles 😉.
Enjoy and until next time!