
Update 2022-11-18: multiple tweaks keeping this post up-to-date
For ease, conformity, and security reasons, it makes sense to host your infrastructure on a single ecosystem as much as possible. Therefore, I prefer to use AWS CodePipeline and AWS CodeBuild as CI/CD solutions when developing on AWS.
Both AWS CodeBuild and AWS CodePipeline do a very decent job; however, I always found
troubleshooting CodeBuild buildspec.yml files difficult and tedious, mainly because access to
the remote CodeBuild session was nonexistent. Well, that was until
AWS Session Manager access for AWS CodeBuild
was announced.
I’m still trying to figure out why, but this great feature’s release went unnoticed!? Even today, when people ask me questions about failing AWS CodeBuild builds, I need to bring this feature to their attention.
Let’s take a closer look at how this looks in practice.
Exploring AWS CodeBuild Debugging
Enabling remote access on AWS CodeBuild, AWS Session Manager brings debug capabilities to your
buildspec files. Besides Session Manager access, the CodeBuild command codebuild-breakpoint is the key to this feature.
No matter if you’ll use the Web console or CLI, first of all, add a breakpoint to your buildspec.yml file.
  build:
    commands:
      - ...
      - codebuild-breakpoint
      - ...
Debug AWS CodeBuild Using the AWS Web Console
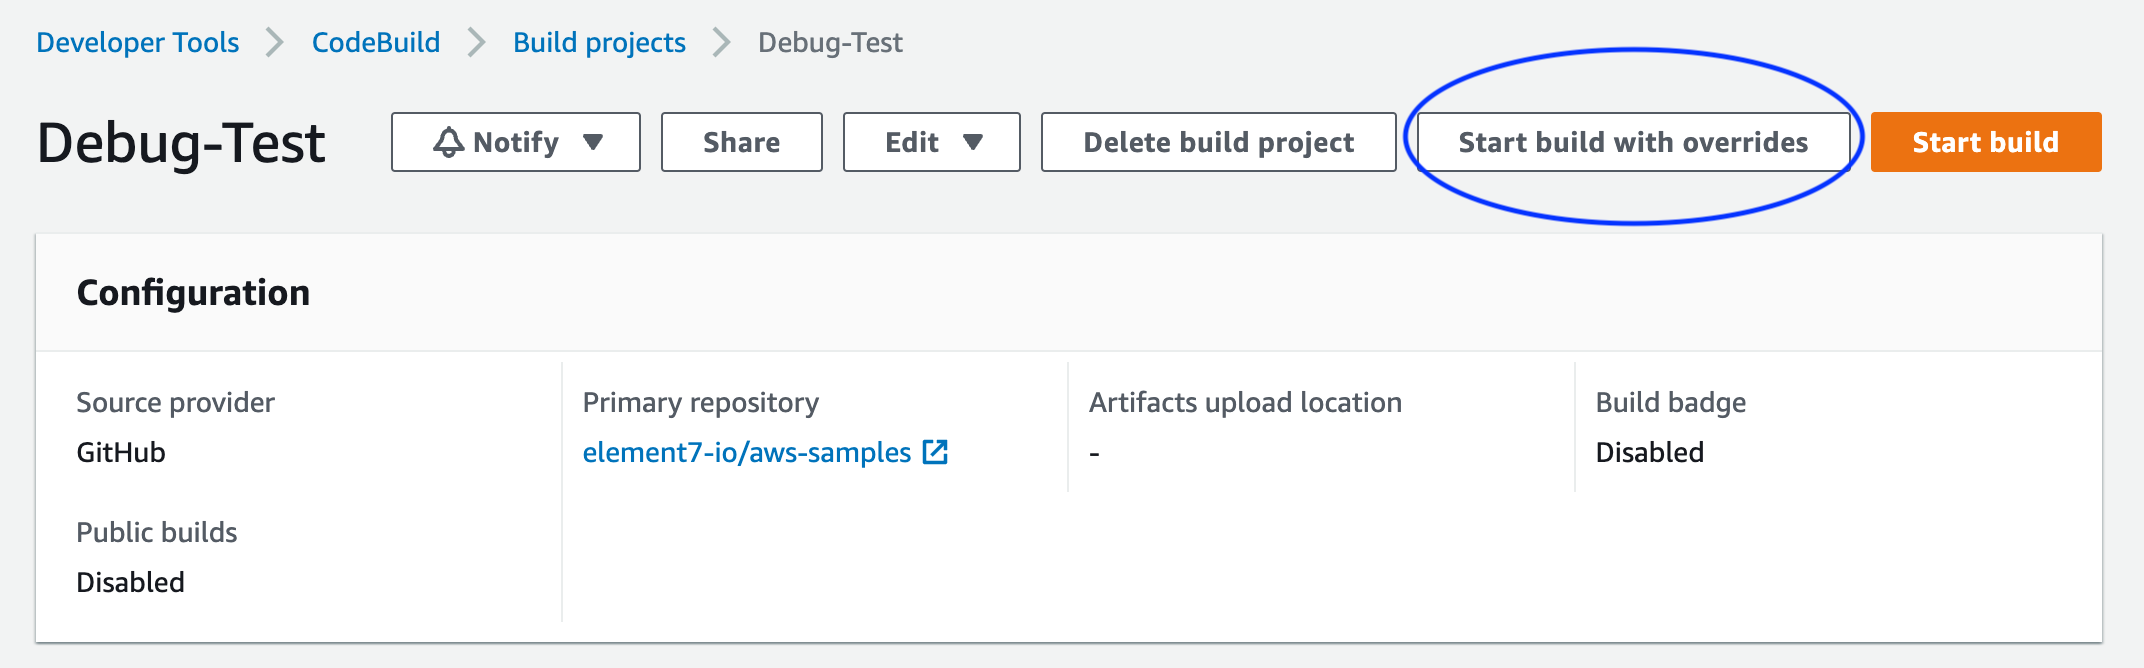
Start a new build with debugging capabilities using Start build with overrides.
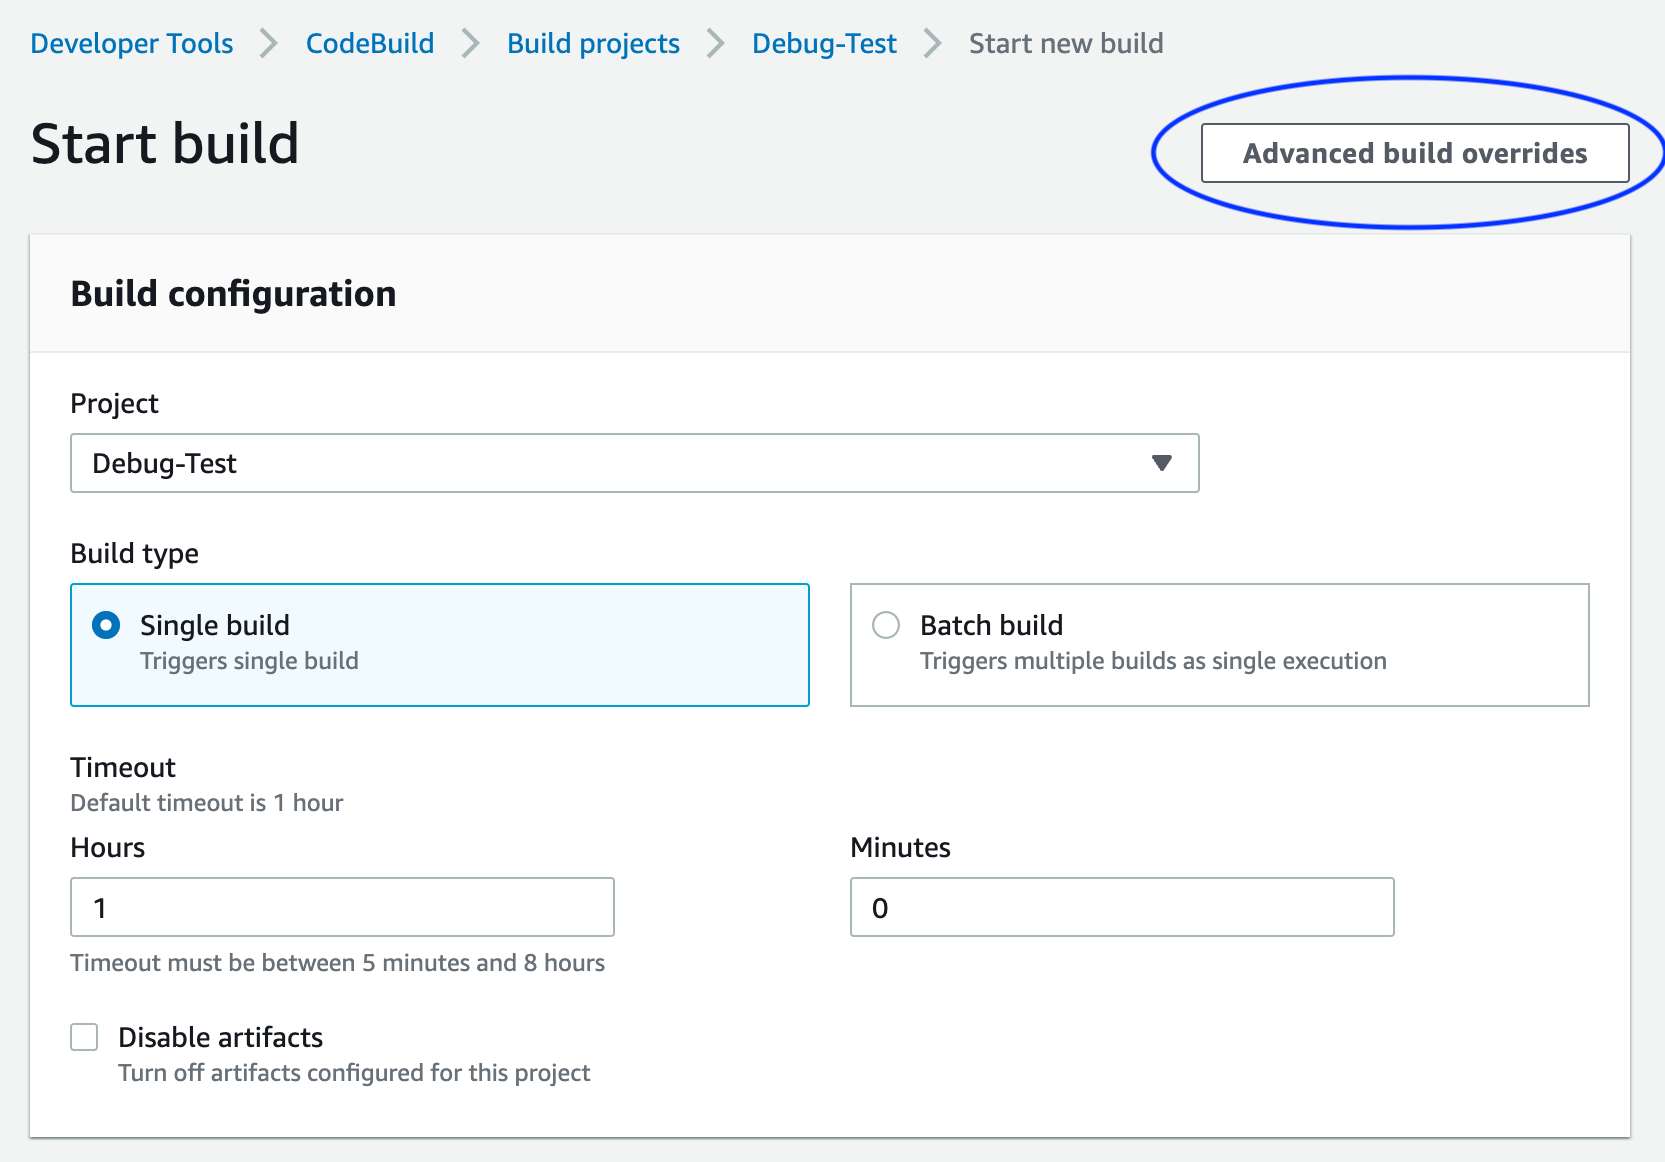
Pick Advanced build overrides.
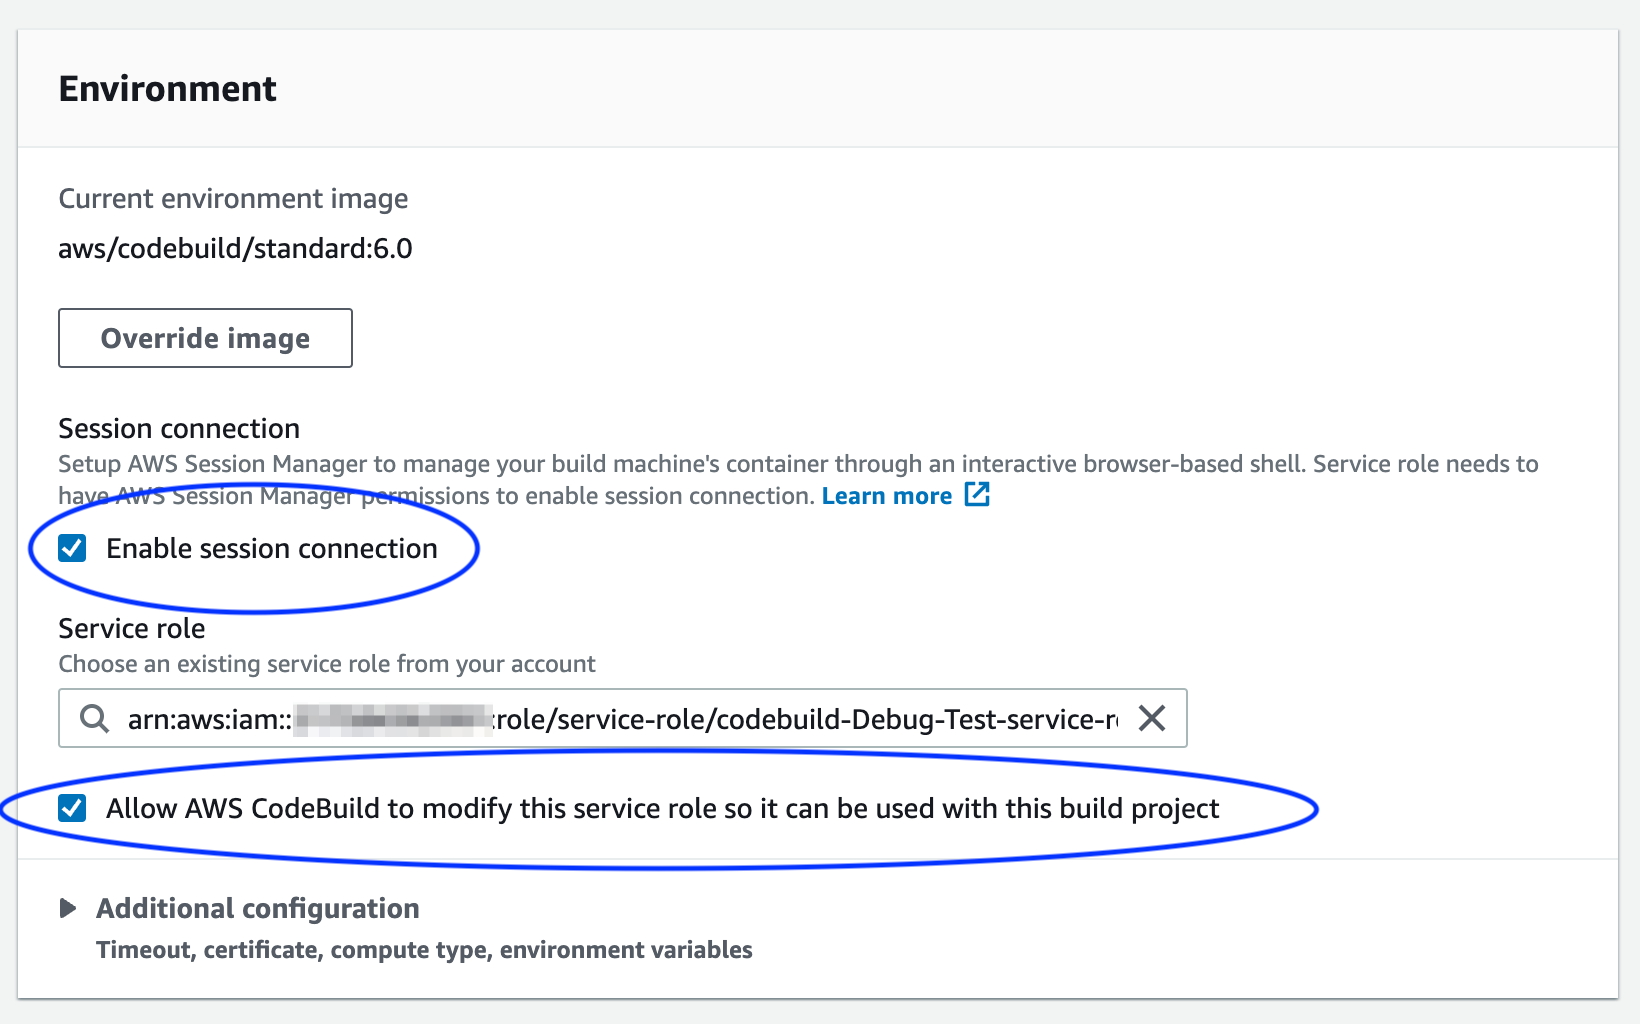
Under Environment, tick Enable session Connection and allow CodeBuild to modify the service role.
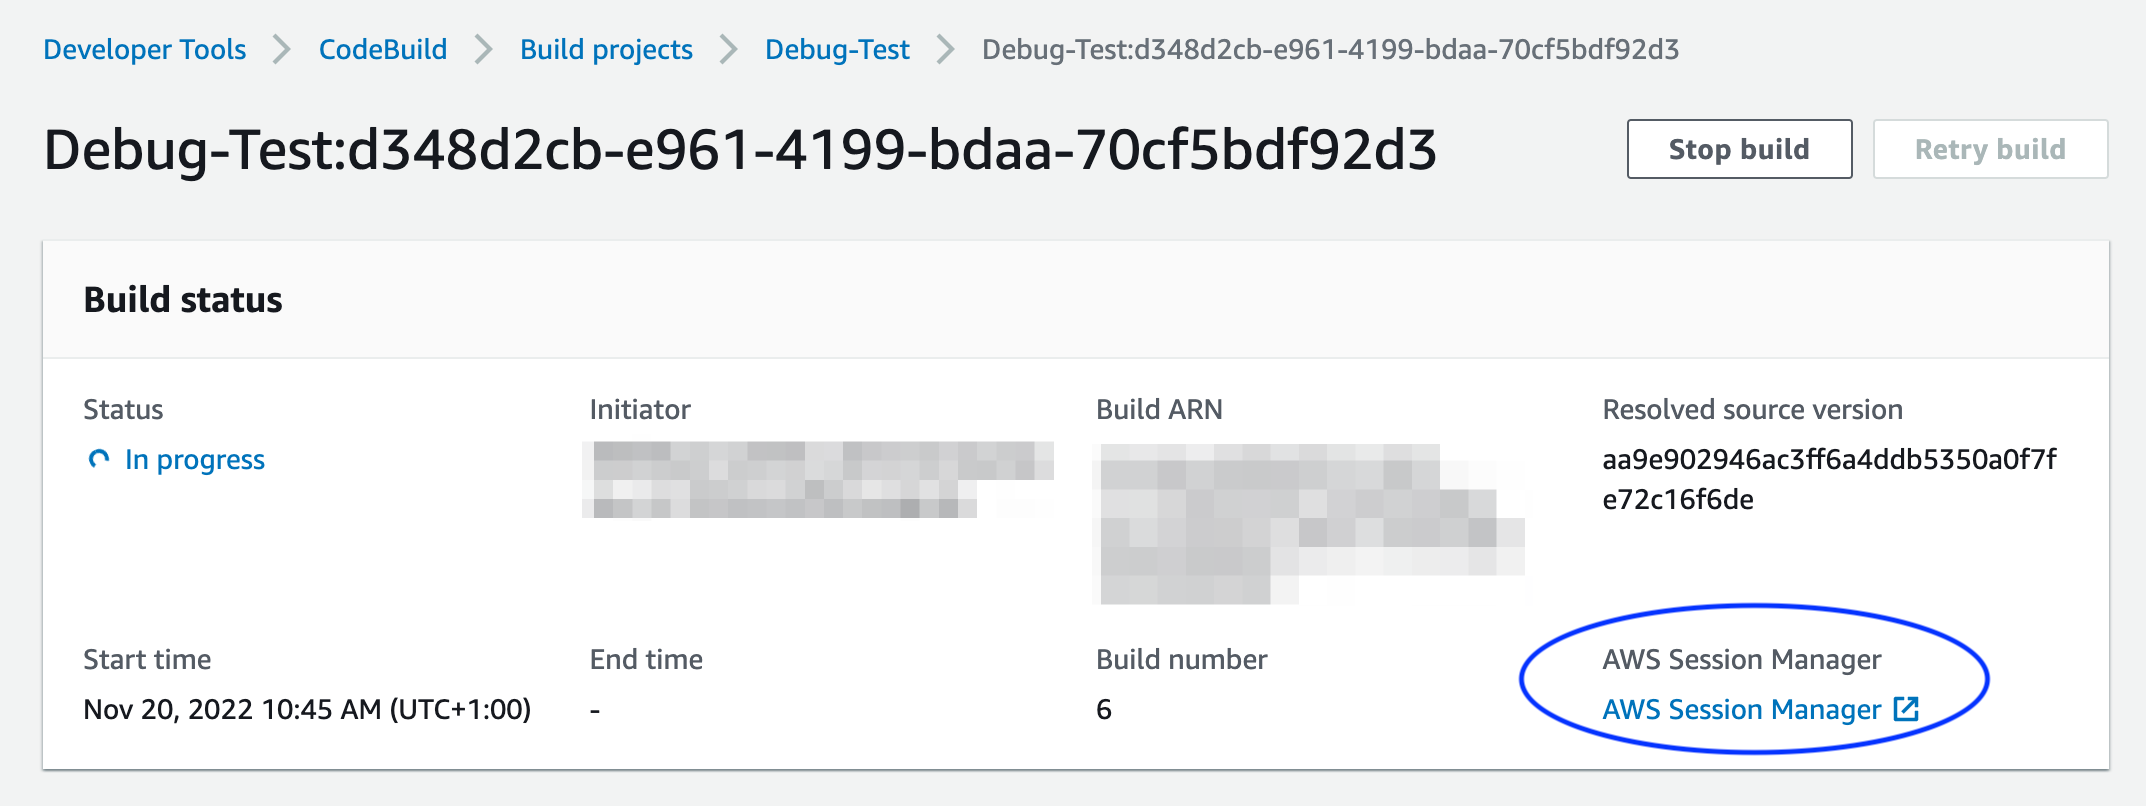
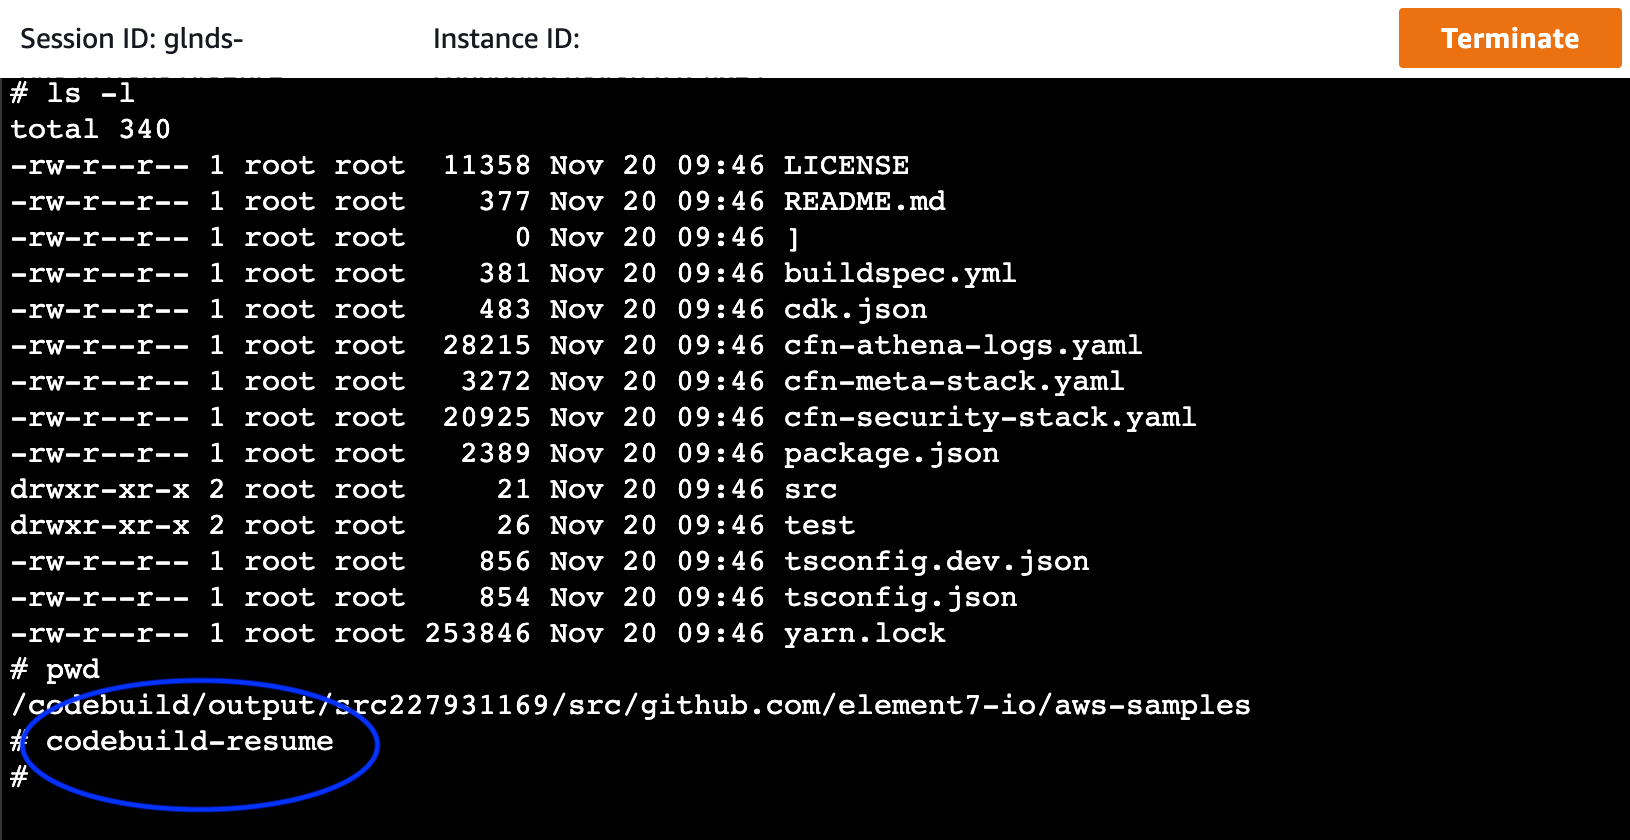
Start the build. Once the build runs, you must select the running build in the Build History.
Under Build Status you’ll find the option to log in to your remote build using Session Manager.
If you click the link, a remote session to your build environment will open. Go ahead and troubleshoot your buildspec in
the remote session. When ready, enter codebuild-resume to continue your build. It’s also safe to
terminate the remote session now.
Debug AWS CodeBuild Using the CLI
Prerequisites
First, verify your CodeBuild Service role includes the following permissions
{
  "Effect": "Allow",
  "Action": [
    "ssmmessages:CreateControlChannel",
    "ssmmessages:CreateDataChannel",
    "ssmmessages:OpenControlChannel",
    "ssmmessages:OpenDataChannel"
  ],
  "Resource": "*"
}
Next, ensure you have the following tools installed before running the CLI commands
The CLI commands
Start a new build and print its Build identifier
aws codebuild start-build --project-name <ProjectName> --debug-session-enabled --output json | jq '.build.id'
Next, get the sessionTarget using the Build identifier
aws codebuild batch-get-builds --ids <BuildID> --output json | jq '.builds[0].debugSession.sessionTarget'
Finally, use the sessionTarget to start a new remote session
aws ssm start-session --target <sessionTarget> --region <region>
Now, you enter your remote build using Session Manager
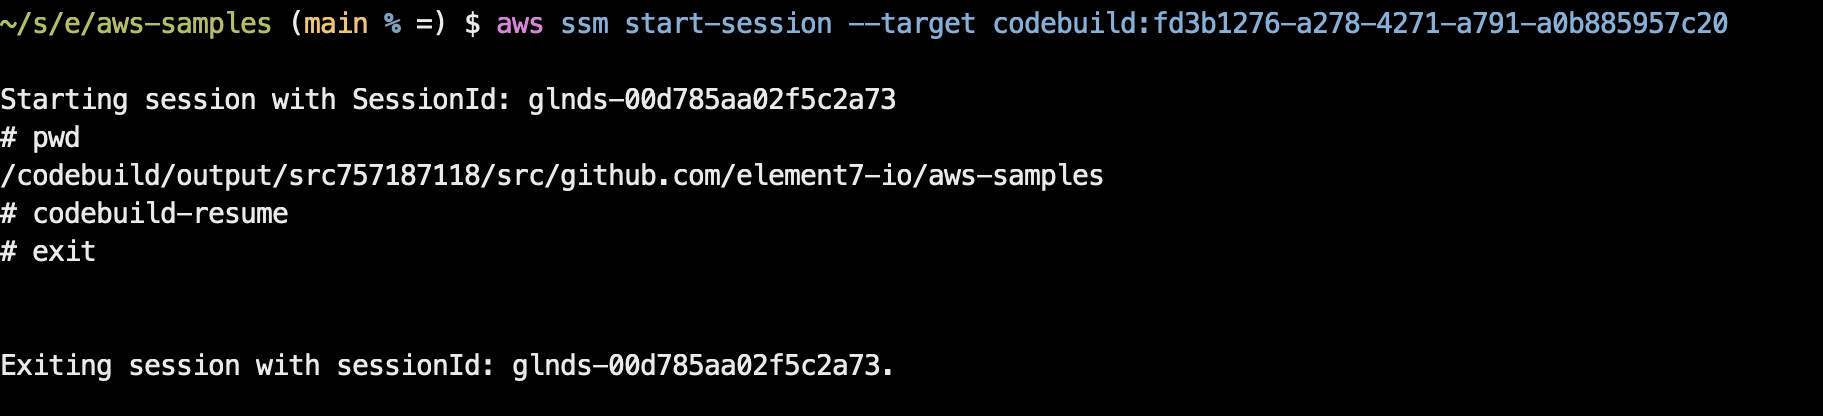
To stop a debug session execute codebuild-resume and exit your session.
That’s all you need to know 😉
Remark: if using Amazon S3 to store your logs ensure to adjust your CodeBuild Service role accordingly. In case that policy is missing you get an SSM Session with a stuck prompt without further feedback. So, if using S3 to store your logs, ensure to have that policy right.
Reference: View a running build in Session Manager
Enjoy and until next time!